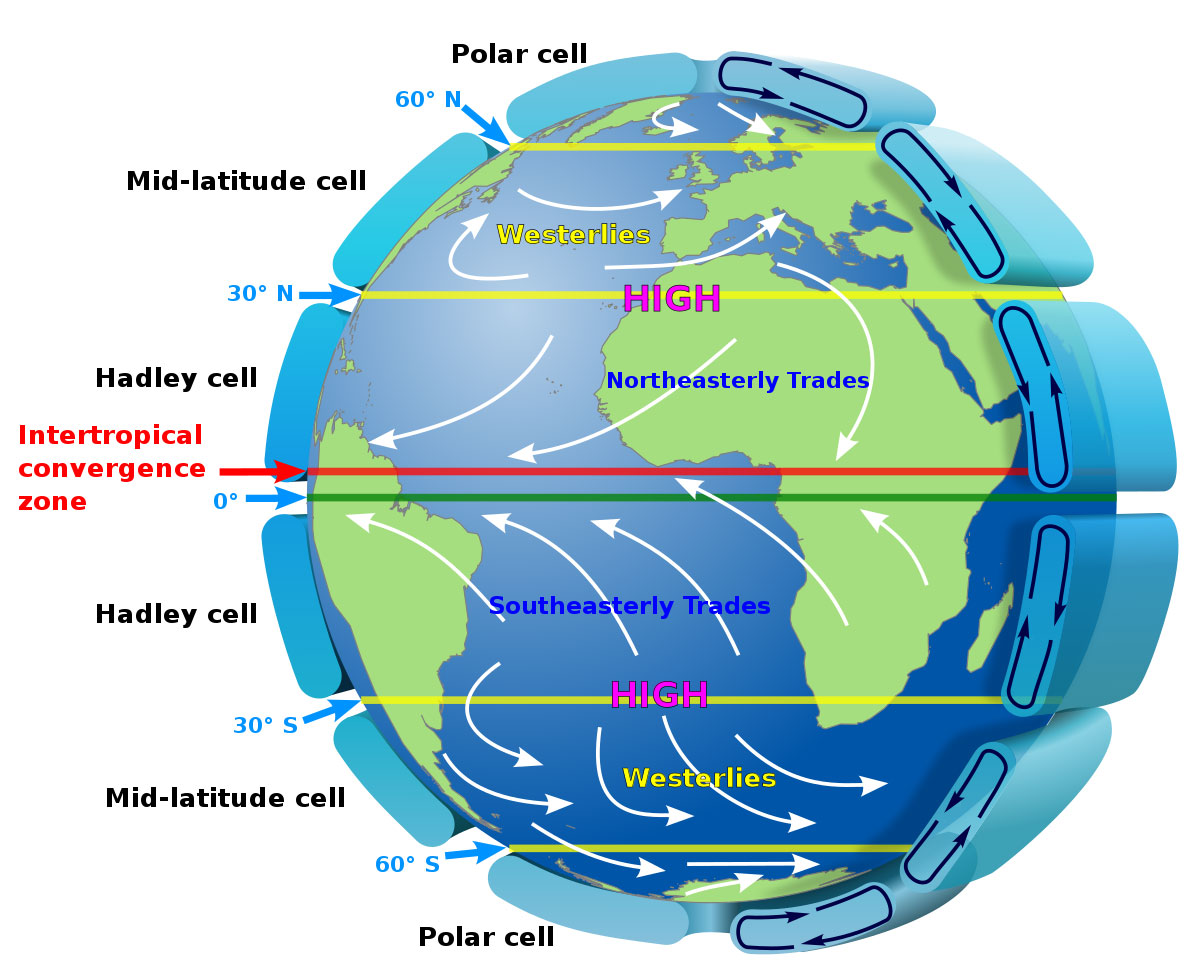
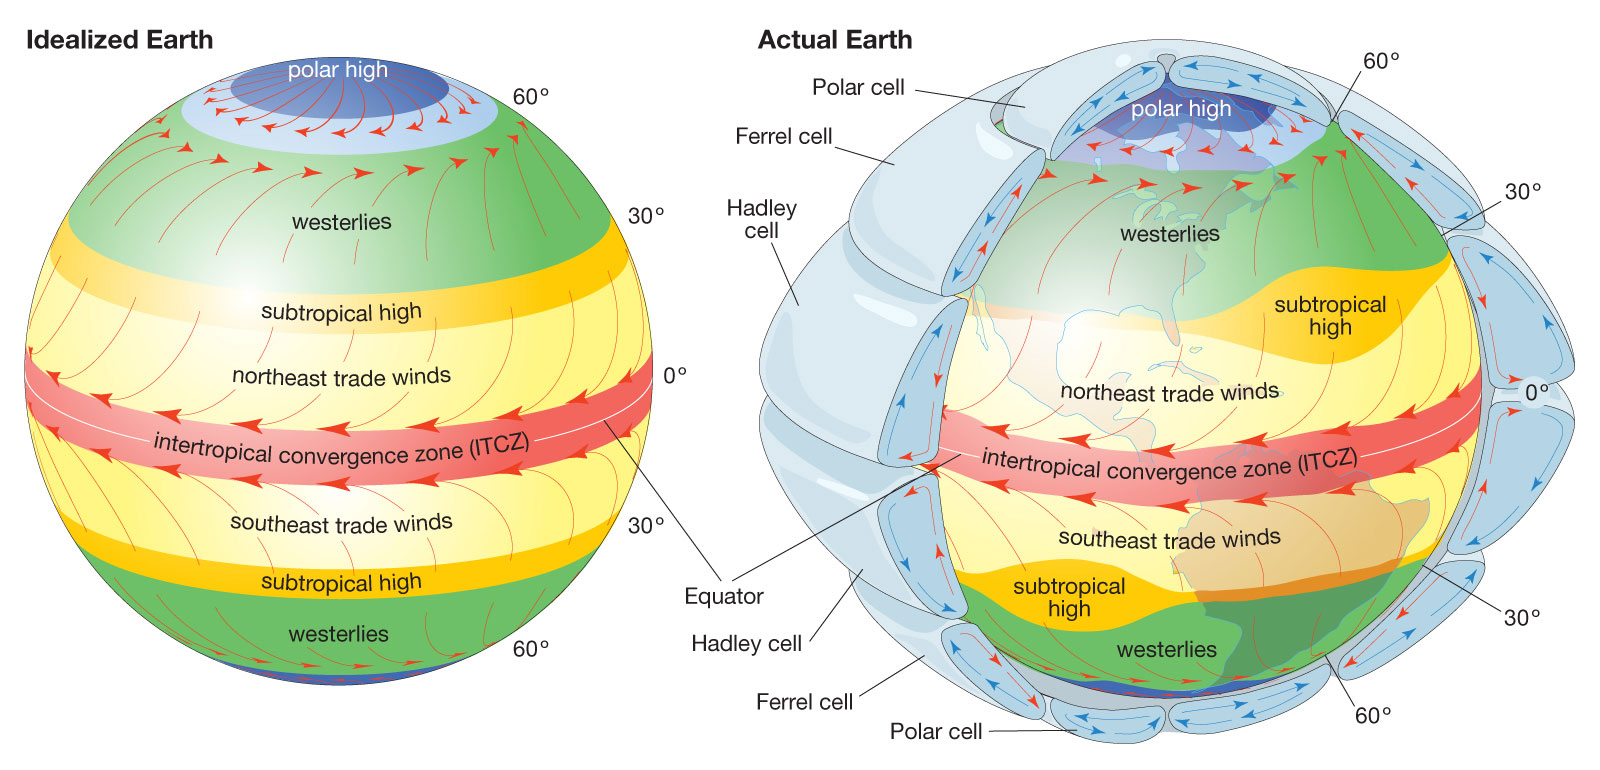
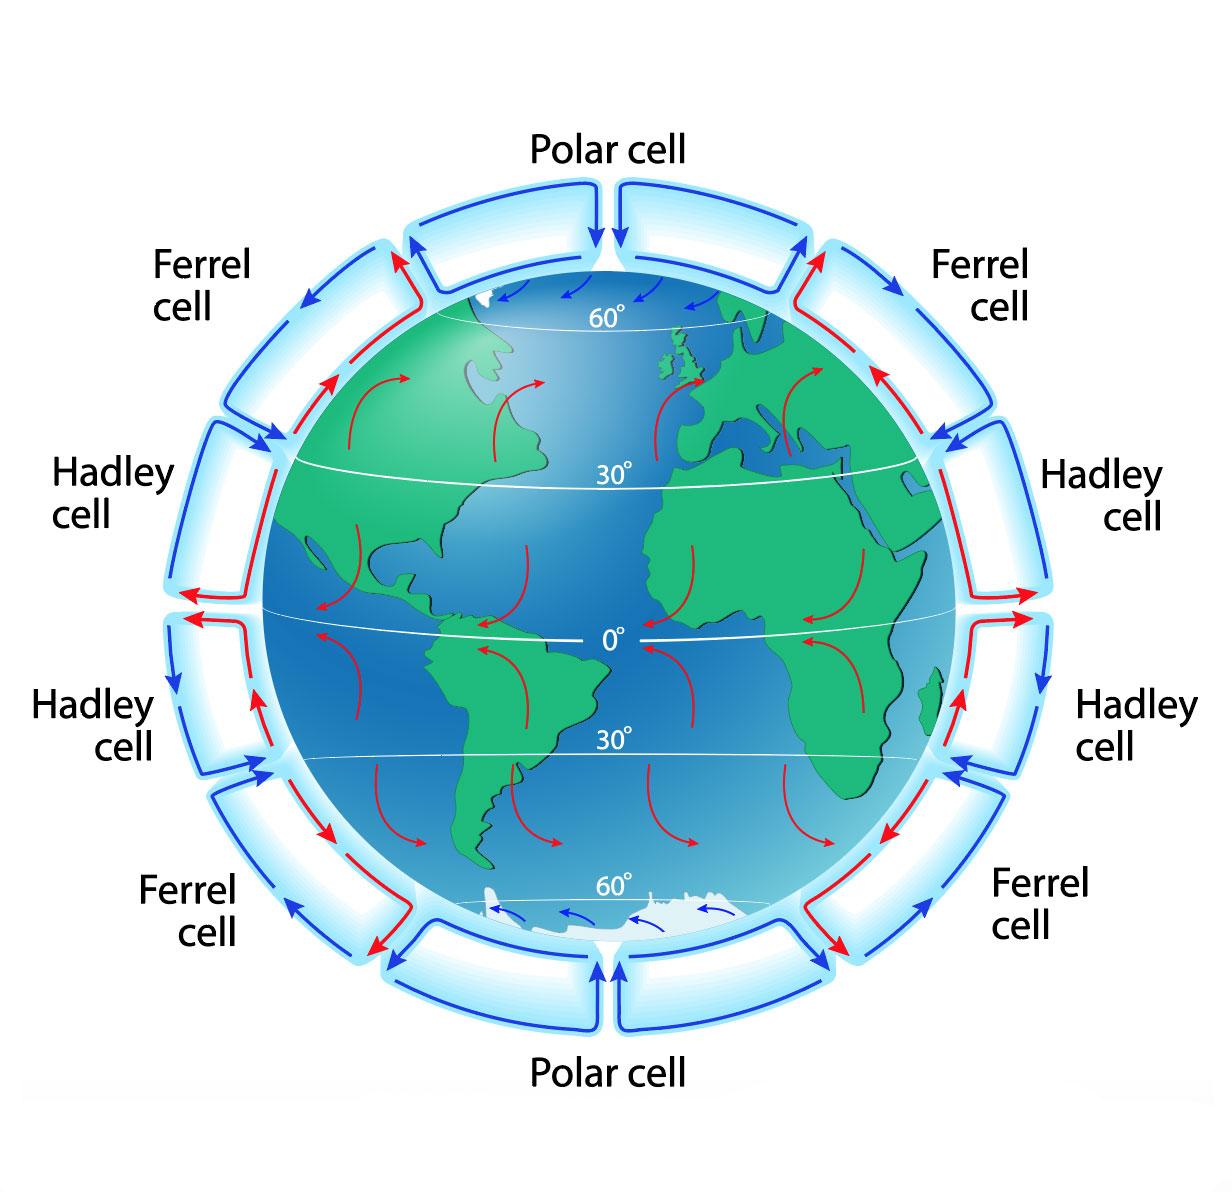
Atmospheric circulation diagram represents the movement of air around the Earth’s surface.
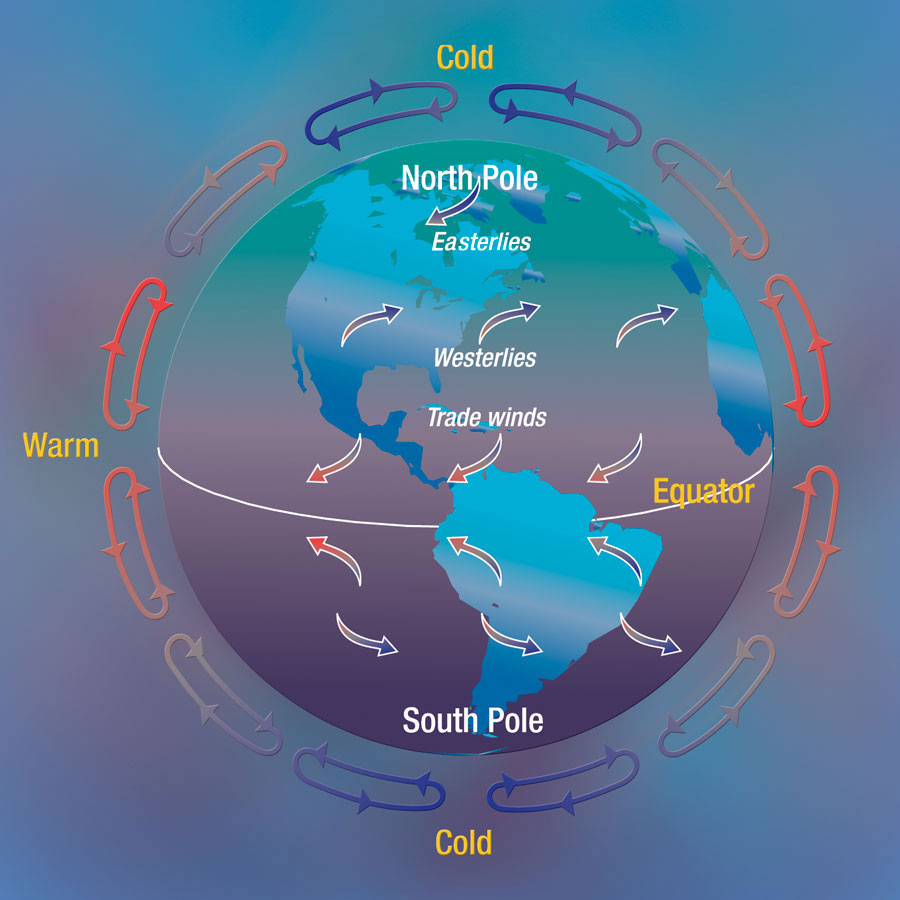
- Equator: It is the imaginary line around the Earth’s surface, where the sun’s rays are directly overhead and the temperature is high.
- Tropics: The region between the equator and the tropic of cancer and the tropic of Capricorn.
- Polar Regions: The areas around the North and South poles.
- Trade winds: The winds that blow from the high-pressure area around the subtropical regions towards the equator.
- Westerlies: The winds that blow from the high-pressure area around the polar regions towards the lower pressure areas in the mid-latitudes.
- Polar easterlies: The winds that blow from the high-pressure area around the polar regions towards the mid-latitudes.
- Coriolis effect: The apparent deflection of moving air due to the rotation of the Earth.
- Hadley cells: The large-scale atmospheric convection cells that exist between the equator and the tropics.
- Ferrel cells: The large-scale atmospheric convection cells that exist between the mid-latitudes and the polar regions.
- Polar cells: The large-scale atmospheric convection cells that exist around the polar regions.
- Jet streams: The fast-moving air currents that exist in the upper atmosphere, typically at high altitudes and high latitudes.
- High-pressure areas: Areas of the atmosphere where the air is sinking, resulting in dry and clear weather.
- Low-pressure areas: Areas of the atmosphere where the air is rising, resulting in cloudy and rainy weather.